
THE PROCESS
Discover
-
Discovery workshop boards
-
Competitor analysis & SWOT matrices
-
Analytics reports & heatmaps
-
User interview guides & findings
-
Contextual inquiry observation maps
Define
-
Mind maps & research synthesis boards
-
User personas & profiles
-
Current-state journey maps
-
Opportunity catalogues & use case maps
-
Prioritisation matrices
-
Design principles & experience requirements
-
Experience roadmaps & measurement plans
Design
-
Future-state journey maps & service blueprints
-
Information architecture diagrams
-
User flow diagrams
-
Conversation flows & AI agent workflow diagrams
-
Storyboards
-
Sketches & wireframes
-
Moodboards & visual direction boards
-
AI-assisted exploration boards
-
High-fidelity screen designs
-
Interactive prototypes & microinteraction demos
Validate
-
Test plans, task scripts & evaluation criteria
-
Usability testing reports
-
Conversation test matrices
-
Accessibility audit reports
-
Design review & issue logs
-
Before-and-after iteration boards
Deliver & Evolve
-
Brand guidelines & design foundation sheets
-
Design token tables & component libraries
-
Design system documentation
-
Developer handover packs
-
Design-to-code examples
-
Design QA reports
-
Design system governance records
-
Post-launch performance dashboards
-
A/B test reports
-
Improvement backlogs & updated roadmaps

Discover
Discovery workshops
Collaborative workshops surface stakeholder perspectives, explore challenges and build a shared understanding of the experience to improve.
Tools used:
FigJam, Miro, Microsoft Whiteboard, Microsoft Teams, ChatGPT, Claude, Microsoft Copilot, Sketch, Powerpoint

Competitor analysis
Involves assessing competitor sites to see how they design for their users - potentially solving for similar user needs. They can be direct competitor companies operating in the same sector or they can share features
Tools used:
ChatGPT, Claude, Microsoft Copilot, Fireshot, Powerpoint, Invision

User
interviews
Interviews with actual target users in understanding their tasks and motivations, their likes, dislikes, wishes, their savviness in the area/domain, opportunities that can be capitalised on etc...
Tools used:
FigJam, Miro, ChatGPT, Claude, Word, Excel, Powerpoint,
Survey monkey, Camtasia

Heatmap
analysis
Eye tracking and Scroll maps are important parts of Heatmap analysis. It records various elements of eye position and movement and scroll depths inorder for the user to take an action.
Tool used:
Ms. Clarity, Crazy Egg


Contextual Inquiry & Observation Mapping
Mapping task steps, behaviours, questions and friction to understand how people navigate financial services in their everyday context.
Tool used:
FigJam, Miro, Microsoft Whiteboard, Microsoft Visio, OneNote, Word, Excel, Teams, Zoom, Camtasia, Snagit, physical whiteboards & sticky notes.

Define
Mind maps
Mind maps are diagrams that visually illustrate how words, phrases, ideas, or concepts relate to a central key word or phrase. They are a visual thinking tool that helps to structure information and identify connections between items.
Tools used:
FigJam, Miro, Draw.io, Lucidchart, Cacoo, Sketch, Adobe XD, Powerpoint, Word

Research Synthesis & Affinity Mapping
Organising customer feedback into meaningful themes to identify pain points, understand user needs and inform design opportunities.
Tools used:
FigJam, Miro, Microsoft Whiteboard, Excel, PowerPoint, Visio, physical whiteboards & sticky notes, ChatGPT, Claude, Microsoft Copilot.

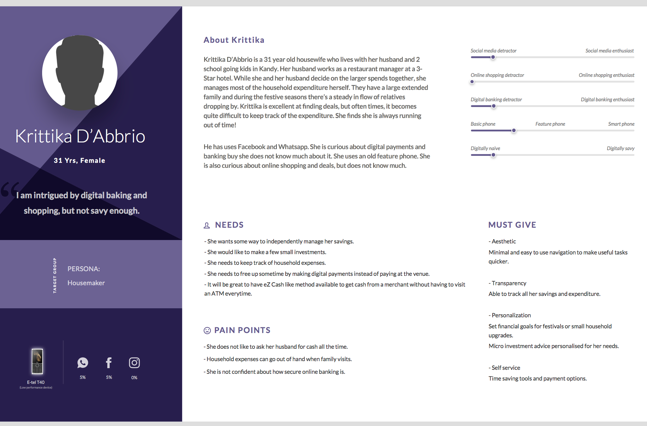
User Persona creation
A persona is a representation of a type of customer. Personas answer the question, “Who are we designing for?” and they help to align strategy and goals to specific user groups.
Tools used:
Figma, FigJam, Miro, ChatGPT, Claude, Sketch, Adobe XD, Powerpoint, Word
User Journey mapping
A Customer Journey map is a visual or graphic interpretation of the overall story from an individual’s perspective of their relationship with an organization, service, product or brand, over time and across channels.
Tools used:
FigJam, Miro, Figma, Sketch, Adobe XD, Powerpoint, Word

Opportunity Catalogue & Use Case Mapping
Connecting customer problems to opportunities and use cases, showing how potential solutions support user goals.
Tools used:
FigJam AI, Miro AI, ChatGPT, Claude, Microsoft Copilot, Excel, Visio.

Opportunity Prioritisation
Comparing opportunities by customer value, delivery effort and dependencies to guide decisions about what to address first.
Tools used:
FigJam AI, Miro AI, ChatGPT, Claude, Microsoft Copilot, Excel, PowerPoint.

Design Principles & Experience Requirements
Translating research insights into principles and actionable requirements that guide consistent design decisions.
Tools used:
FigJam AI, Miro AI, ChatGPT, Claude, Notion AI, Word, PowerPoint.

Experience roadmap & measurement plan
Sequencing experience improvements into phases and defining measures to evaluate progress and outcomes.
Tools used:
FigJam AI, Miro AI, ChatGPT, Claude, Microsoft Copilot, Excel, PowerPoint.

Design
Service Blueprints
Map the customer experience alongside staff actions, backstage processes and system dependencies to show how a service works from start to finish
Tools used:
FigJam, Miro, Lucidchart, Whimsical, Microsoft Visio, OmniGraffle

Storyboards
Show a user’s situation, actions and key moments through a sequence of visual panels, connecting everyday needs with the proposed experience.
Tools used:
FigJam, Miro, Figma, Canva, Adobe Illustrator, Microsoft PowerPoint

Information
Achitecture
Information architecture (IA) is a science of organizing and structuring content of the websites, web and mobile applications, and social media software.
Tools used:
FigJam, Miro, Draw.io, Lucidchart, Cacoo, Sketch, Adobe XD, Powerpoint, Word

User Flow Diagrams
Map the steps, decisions and alternative paths users take to complete a task, including entry points, confirmations and unsuccessful outcomes.
Tools used:
FigJam, Miro, Whimsical, Lucidchart, Microsoft Visio, OmniGraffle

Human Handoff & Error Recovery Flows
Define how users recover from interrupted or unsuccessful tasks and move into human support, preserving context and providing clear next steps.
Tools used:
FigJam, Miro, Lucidchart, Whimsical, Microsoft Visio, OmniGraffle

Sketching & Wireframing
A wireframe is a schematic or other low-fidelity rendering of a computer interface, intended to primarily demonstrate functionality, features, content, and user flow without explicitly specifying the visual design of a product.
Tools used:
Figma, FigJam,, Axure, Balsamiq,
Omnigraffle, Sketch

Moodboarding
It’s a visual representation of the stylistic direction for the project. It allows both clients and designers to weigh in with a quicker, deeper understanding than words alone can bring.
Tools used:
Figma, FigJam, Miro, Pinterest, Evernote, Dribble

Visual
design
Visual design is the process in which we create an overall style guide for the product and based on the style guide each individual screen's look and feel is designed. Colors, images, spacing, padding, font size etc... comes into place at this stage.
Tools used:
Figma; Figma Make, Lovable and v0, Sketch, Adobe XD, Photoshop, Illustrator

Micro
interactions
Micro-interactions are events which have one main task — a single purpose — and they’re found all over your device and within apps. Their purpose is to delight the user; to create a moment that is engaging, welcoming and, dare we say it — human.
Tools used:
Figma Motion, Figma interactive components, Principle (Mac), Adobe AfterEffects. Flinto

Validate
Usability testing
Usability testing refers to evaluating a product or service by testing it with representative users. Typically, during a test, participants will try to complete typical tasks while observers watch, listen and takes notes.
Tools used:
Figma, Crazy Egg, Optimizely, Sketch, Adobe XD, Powerpoint, Word

Deliver & Evolve
Dev. handover
via Zeplin
The process of handing off designs and style guides with accurate specs, assets, code snippets—automatically. Zeplin helps in improving the collaboration between designers and developers.
Tools used:
Sketch, Zeplin plugin for Sketch, Zeplin app
